 Money in One Chart
where money goes
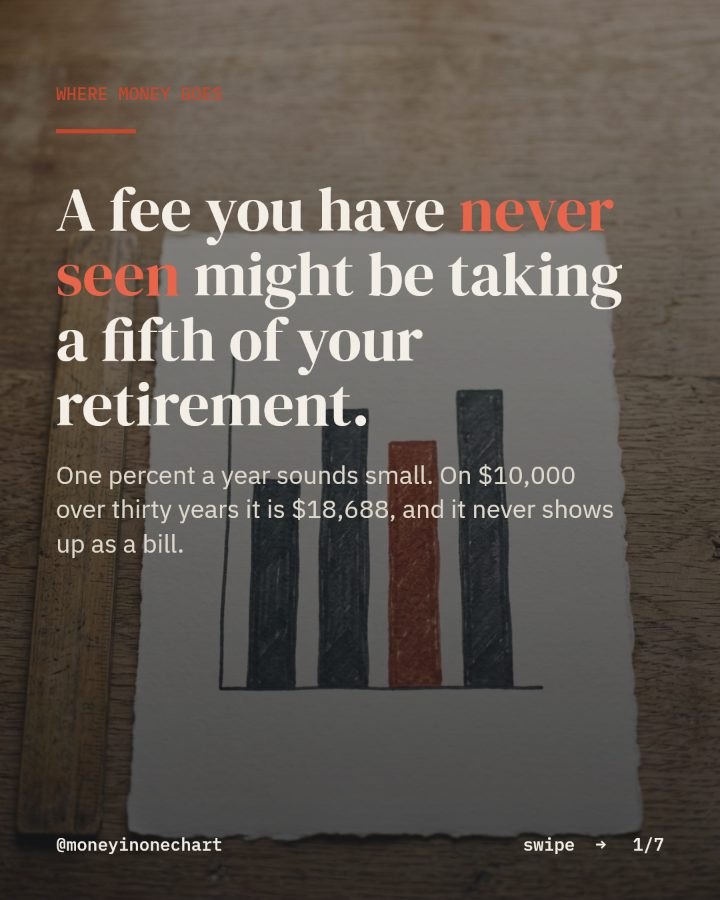
A fee you have never seen might be taking a fifth of your retirement.
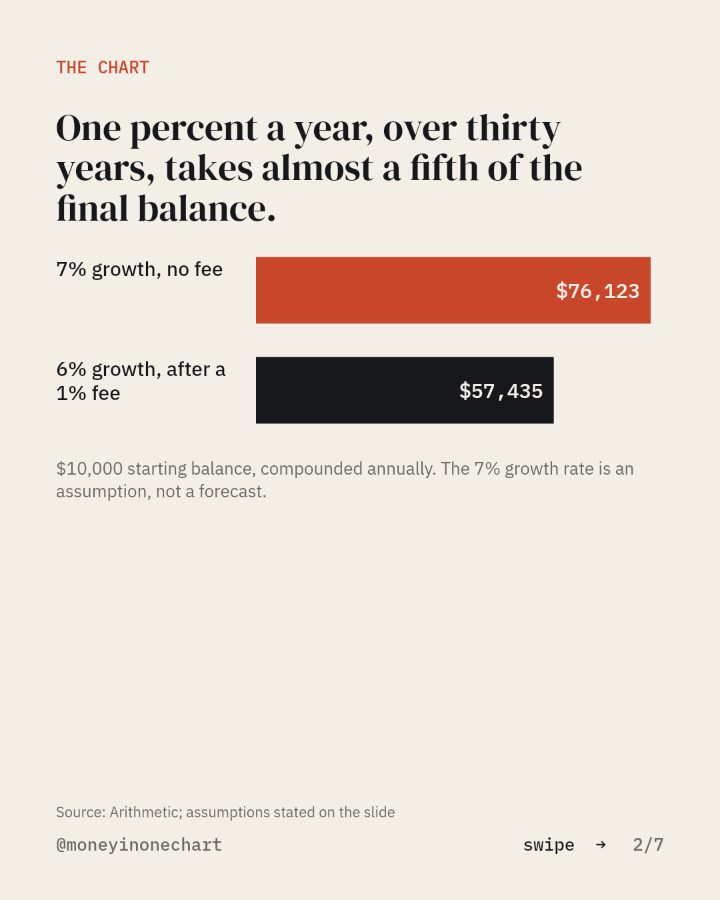
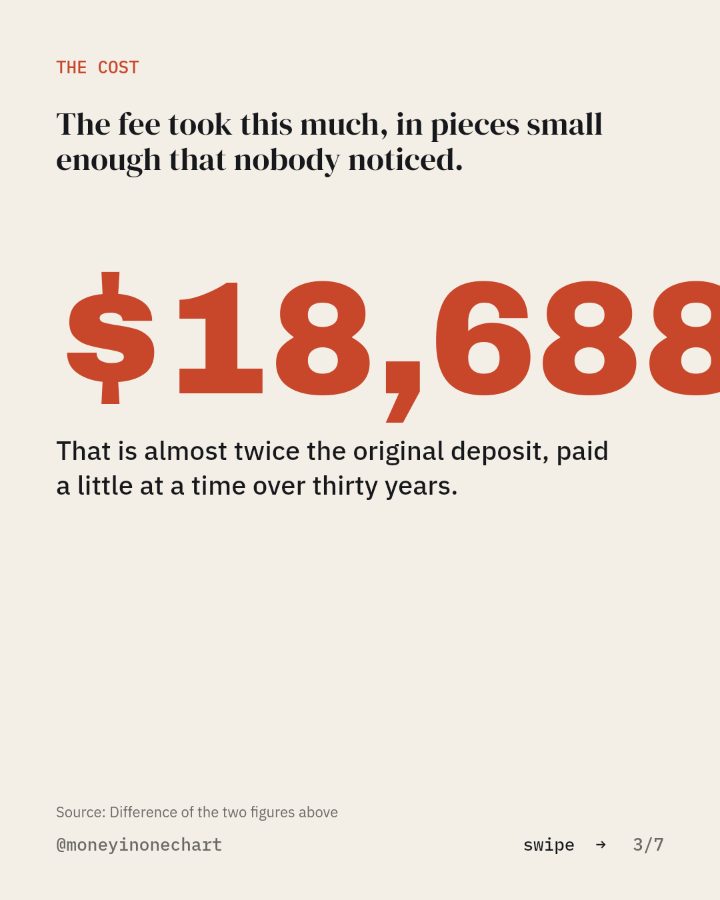
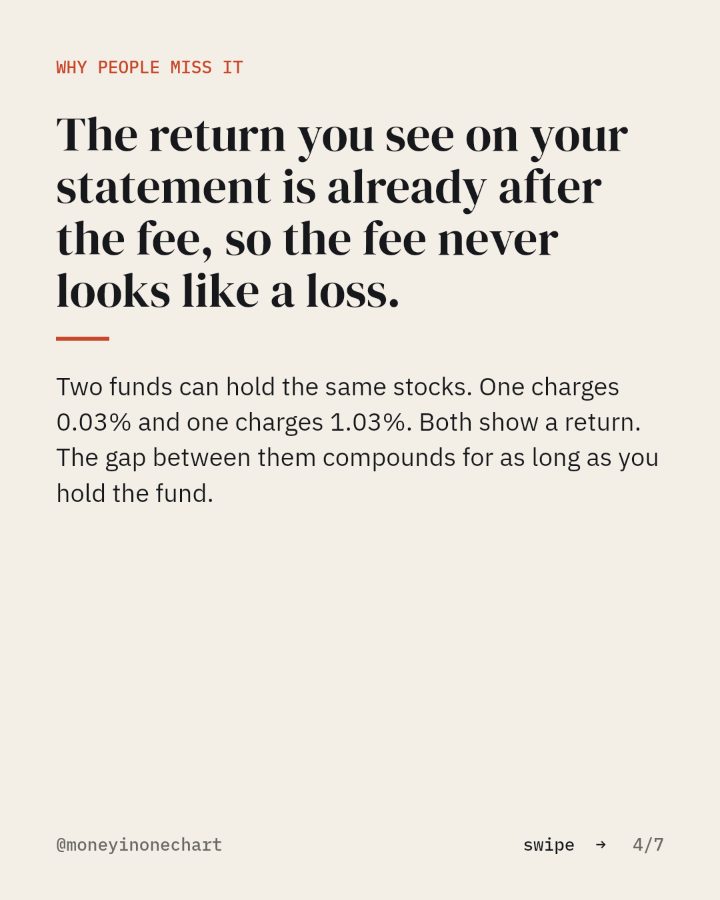
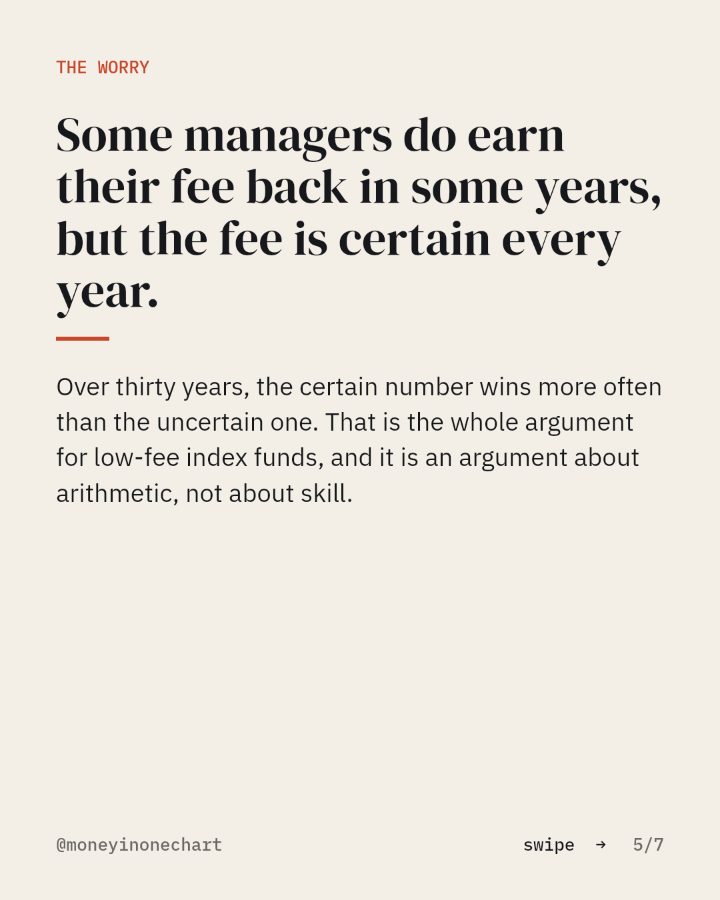
One percent a year sounds small. On $10,000 over thirty years it is $18,688, and it never shows up as a bill.
You asked for the fee calculator sheet. It is below, as the slides from the post, then the one move, then the tool the chart points at.
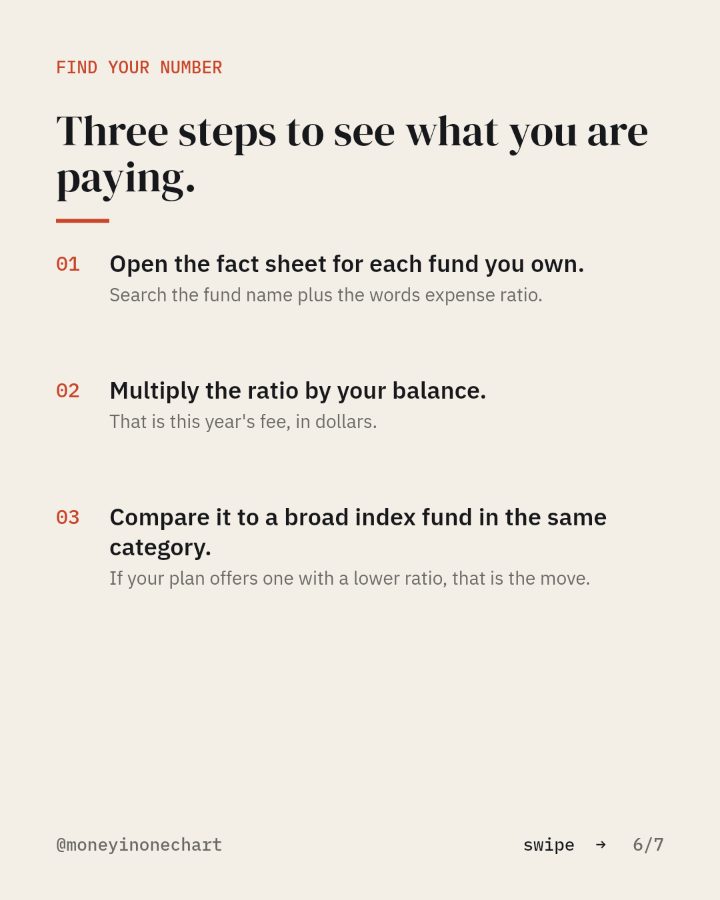
Three steps to see what you are paying.
- 01Open the fact sheet for each fund you own.Search the fund name plus the words expense ratio.
- 02Multiply the ratio by your balance.That is this year's fee, in dollars.
- 03Compare it to a broad index fund in the same category.If your plan offers one with a lower ratio, that is the move.
The tool this chart points at
A low-fee brokerage
For the IRA, the index fund and the rollover. Broad index funds with expense ratios under 0.1%.
Open itThis link may pay Money in One Chart a referral fee if you open an account. Your price does not change. How that works.
Sources: Arithmetic; assumptions stated on the slide; Difference of the two figures above.